/webcode.jsp
/en/search/index.jsp
The IFA conducts the whole statistical analysis. The data received is immediately anonymised at the IFA. Since 2011, QuoData's (QuoData GmbH Quality & Statistics, 01309 Dresden, https://quodata.de/de) Prolab Plus software has been used for interpretation of the results of the PT schemes . The interpretation meth¬ods employed in the software fully satisfy the requirements of DIN ISO 13528, DIN ISO 5725-2, -3, -5; and DIN 38402 A 45 [1-5].
The PT schemes are evaluated in accordance with DIN ISO 5725-2. The basis for scoring of the participants is the evaluation by the "z-score" [2].
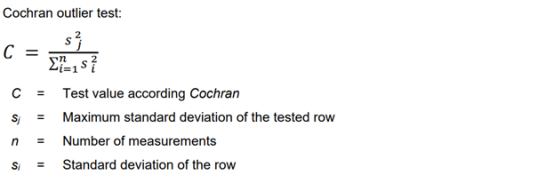
Previous to the calculation of the statistical values the outliers are determined. For determi-nation of the outliers the Grubbs test is used.
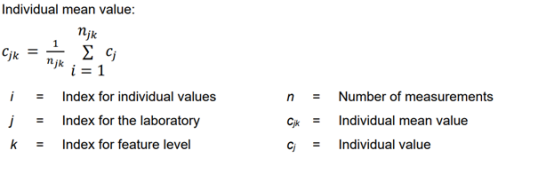
For the PT scheme VOC the participants are supposed to indicate more than one individual value.
In this case, before calculating the individual mean value, the Cochran-test is used. I.e. if the difference between the results of a laboratory is too large, it is possible to disregard these results for further evaluation. The remaining individual results are averaged for each hazardous substance and weighed statistically, if applicable (see DIN ISO 5725-2 section 7.5.6 [4]).
Individual mean values are only calculated for proficiency testing schemes with more than one individual value (PT scheme VOC).
The dispersion of the individual values of laboratories are analysed with the outlier test according to Cochran:
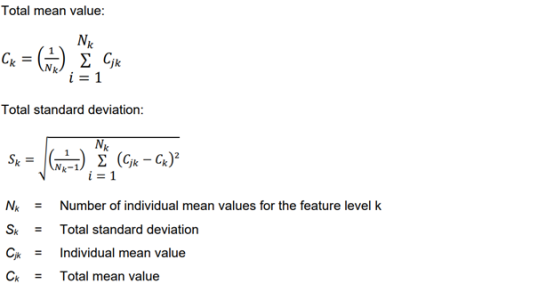
The total mean value Ck is then calculated, which generally serves as the reference value during the evaluation. At PT schemes with low number of participants the mean concen¬tration found while analysing quality control samples can be defined as target concentration. This value is used for further statistical analyses such as the total standard deviation Sk, Grubbs test and z-score. Where certified materials are employed, the concentration stated on the certificate is defined as the reference value. The total mean value and total standard deviation are calculated from the data.
It is generally assumed that the body of data is subject to normal distribution. The outlier test is then performed at the 95% level (both sides α = 2.5%). The elimination of outliers ulti¬mately produces a mean value which closely approximates to the "true value" of the sample.
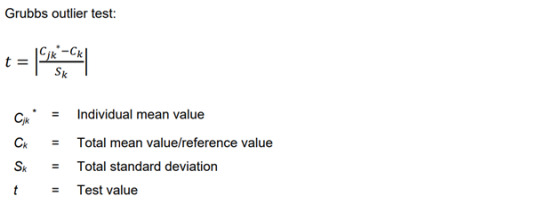
In the Grubbs outlier test, the procedure is for all laboratory mean values to be calculated in the first instance and the total mean value and total standard deviation then to be determined from them. The difference is then formed between the individual mean values and the refer-ence value/total mean value, the individual mean value with the greatest difference to the reference value/total mean value being substituted marked * in the formula of the Grubbs outlier test. The test value t is compared to the tabular value for a significance level of α = 2.5% when considered from both sides (see above).
If it is confirmed as an outlier, it is removed from the body of data, and the total mean value and total standard deviation recalculated. The difference between the new total mean value/ reference value and the individual mean values is calculated and the greatest difference substituted in the Grubbs formula. If this value is also confirmed as an outlier, it is likewise removed. The procedure is repeated until no more outliers can be eliminated.
Should the data exhibit such strong variation that no outliers can be identified by means of the Grubbs test, they are defined by the deviation from the reference value. An outlier is recognized as such in this case when the deviation > ± 36%. Where the data material is heterogeneous, the limit can be increased to 50%, or identification of the outliers not be performed.
All individual mean values are considered in the z-score analysis, including the values identified as outliers in the Grubbs test.
The z-score of all participating laboratories, including those eliminated as outliers, is calculated with the aid of the outlier-free mean value and the outlier-free standard deviation.
The z-score can be regarded as the quality characteristic of the mean value of the individual laboratories (see below).
The z-score analysis is based upon the following formula:
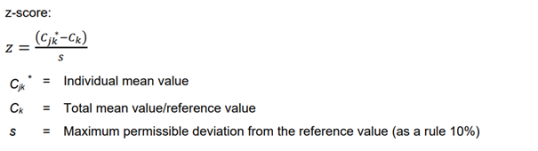
A permissible deviation of 10 % is assumed for s during analysis of the PT scheme. Where data material exhibits strong scatter, the permissible deviation may be increased to up to 15 %. The individual results are then evaluated as shown below:
A result for which |z| ≤ 2 is deemed satisfactory, i.e. the PT is deemed passed. Should the |z| score exceed 2, review of the analysis method employed is advisable.
The z-score can be used to determine further statistically important parameters, which shall not however be considered in any greater detail at this point.
After the evaluation has been completed, each participating measuring station receives a notification of the results. In the online portal, the participants are provided with an evaluation report with the confirmation of participation and an individual certificate for download.
The evaluation report contains the following information:
The integrated confirmation of its participation contains the following information:
The certificate (PDF, 656 kB, non-accessible) is produced individually from each participant's results. The certificate is produced in accordance with the following rules:
[1] DIN ISO 13528: Statistical methods for use in proficiency testing by interlaboratory comparisons (09.20). Beuth, Berlin 2020
[2] DIN ISO 5725-2: Accuracy (trueness and precision) of measurement methods and results - Part 2: Basic method for the determination of repeatability and reproducibility of a standard measurement method (05.22). Beuth, Berlin 2022
[3] DIN ISO 5725-3: Accuracy (trueness and precision) of measurement methods and results - Part 3: Intermediate measures of the precision of a standard measurement method (02.03). Beuth, Berlin 2003
[4] DIN ISO 5725-5: Accuracy (trueness and precision) of measurement methods and results - Part 5: Alternative methods for the determination of the precision of a standard measurement method (11.02). Beuth, Berlin 2002
[5] DIN 38402-45: German standard methods for the examination of water, waste water and sludge - General information (group A) - Part 45: Interlaboratory comparisons for proficiency testing of laboratories (A 45); Berlin, 2014
